Netanya and Kfar Saba in 2026: Sharon Continues to Rise
In the Sharon region, two cities are rising while Herzliya falls back. Kfar Saba gains 4.9% and Netanya, much prized by French speakers, 2.1%.
The real estate prices in Netanya and Kfar Saba continue to rise in 2026, even as Herzliya, the most expensive city in the Sharon region, declines. In the first half of the year, Netanya reached an average price of about 2.73 million shekels (+2.1%) and Kfar Saba about 2.935 million (+4.9%).
Netanya holds a special place for many French-speaking buyers, whether they already live in Israel or are planning a project from abroad. Kfar Saba, further inland, appeals to Israeli families from the center. Analysis.
Sharon in Numbers
| City | H1 2025 | H1 2026 | Change |
|---|---|---|---|
| Herzliya | 3.814 M ₪ | 3.782 M ₪ | -0.9% |
| Kfar Saba | 2.798 M ₪ | 2.935 M ₪ | +4.9% |
| Netanya | 2.674 M ₪ | 2.730 M ₪ | +2.1% |
| Hadera | 2.093 M ₪ | 2.065 M ₪ | -1.3% |
| National average | 2.303 M ₪ | 2.392 M ₪ | +3.9% |
Sharon is not a homogeneous block: the two intermediate cities are growing, while the extremes—Herzliya in the south and Hadera in the north—are declining.
Netanya: a measured increase
At +2.1%, or about 56,000 ₪ more over one year, Netanya is rising more slowly than the national average. A healthy evolution rather than a surge.
What supports prices:
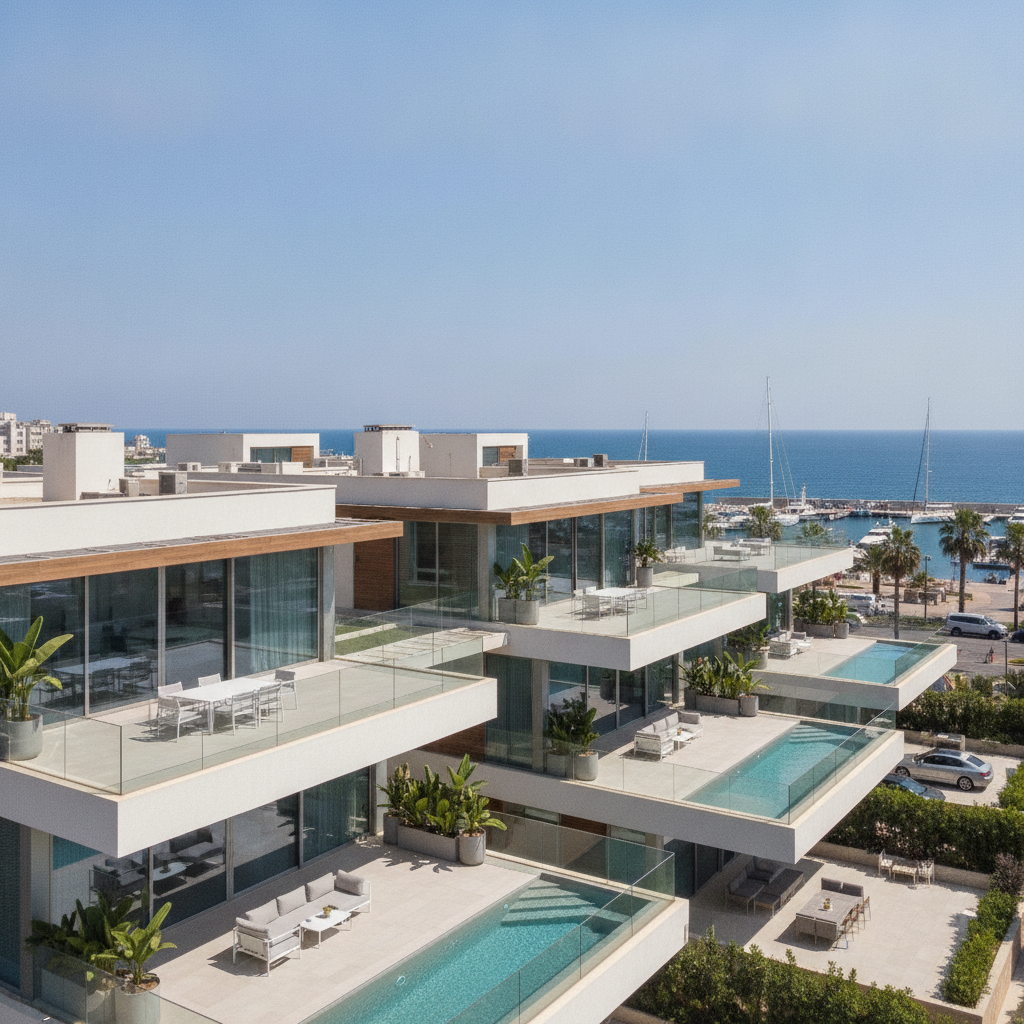
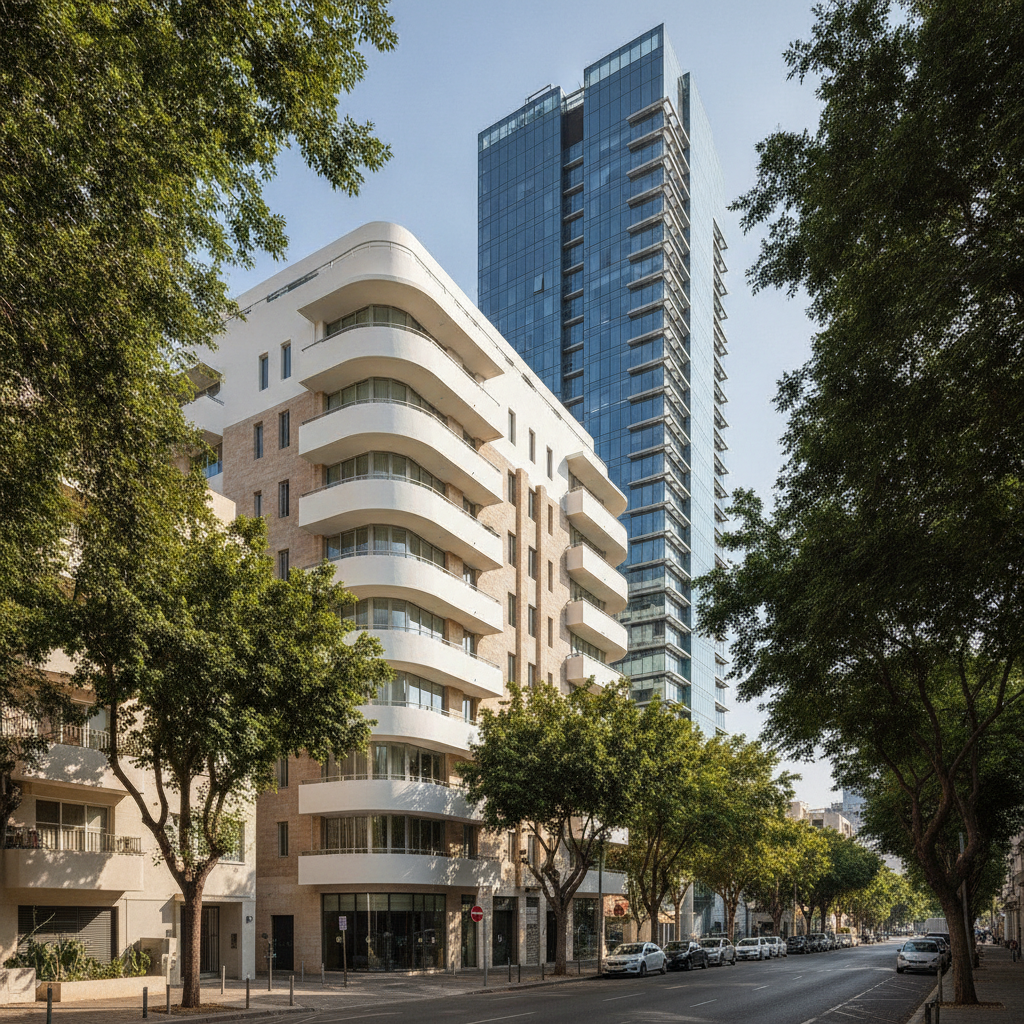
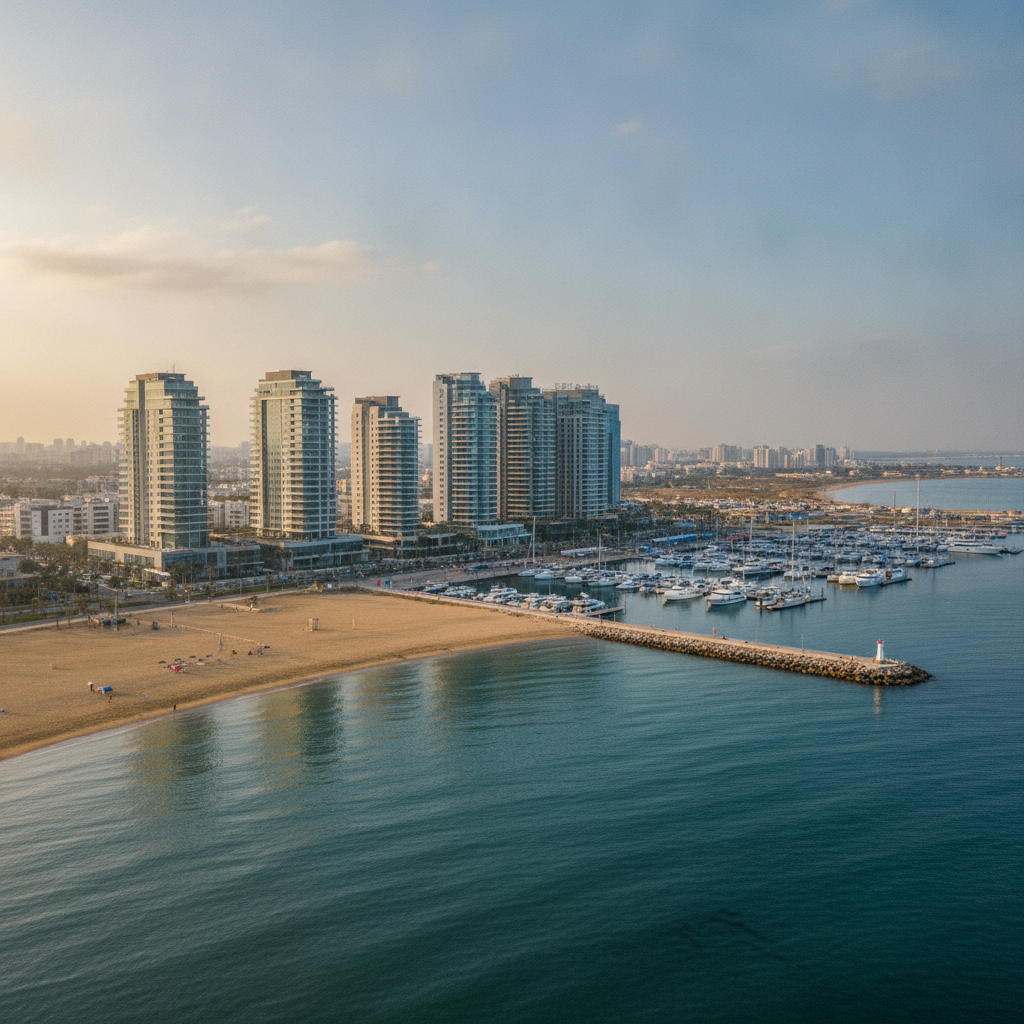
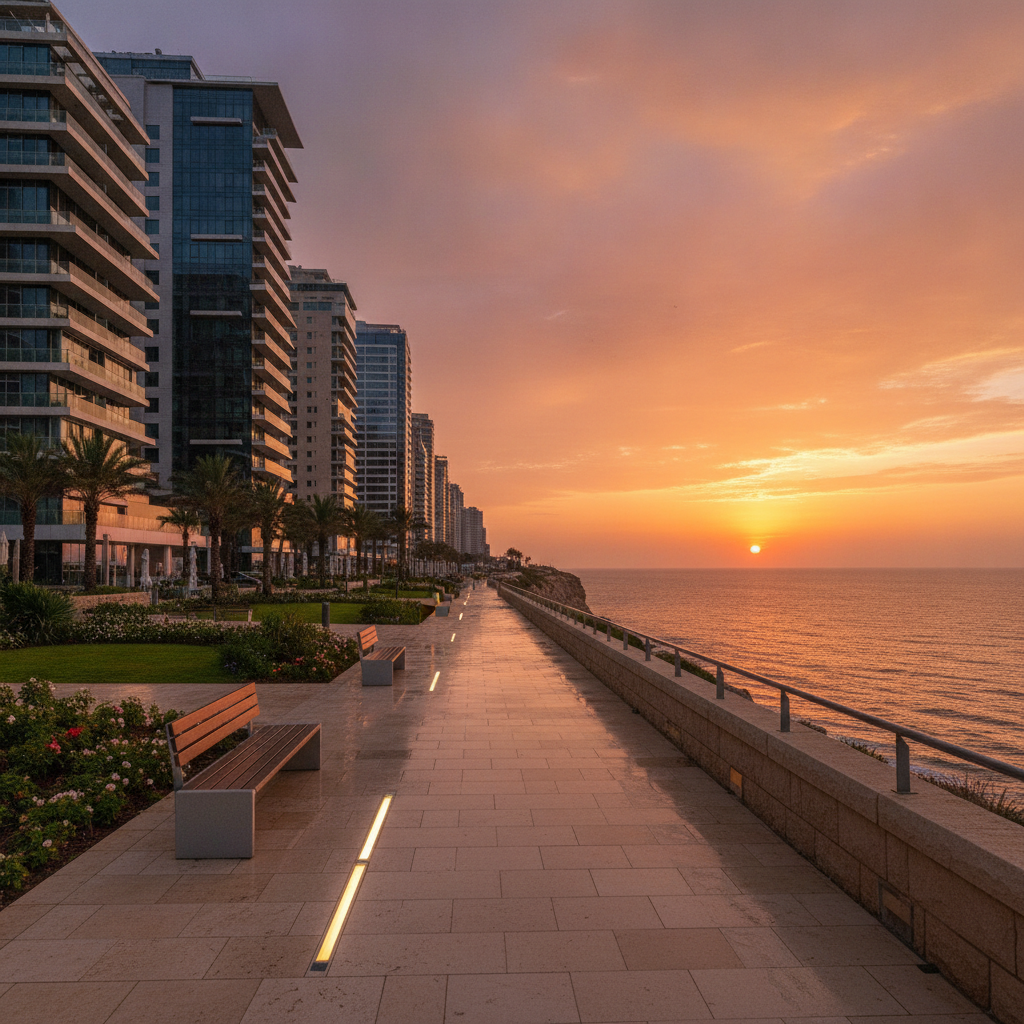
- The seafront and its cliffs, with many recent residential towers;
- A diverse demand: local families, retirees, second-home buyers, new arrivals;
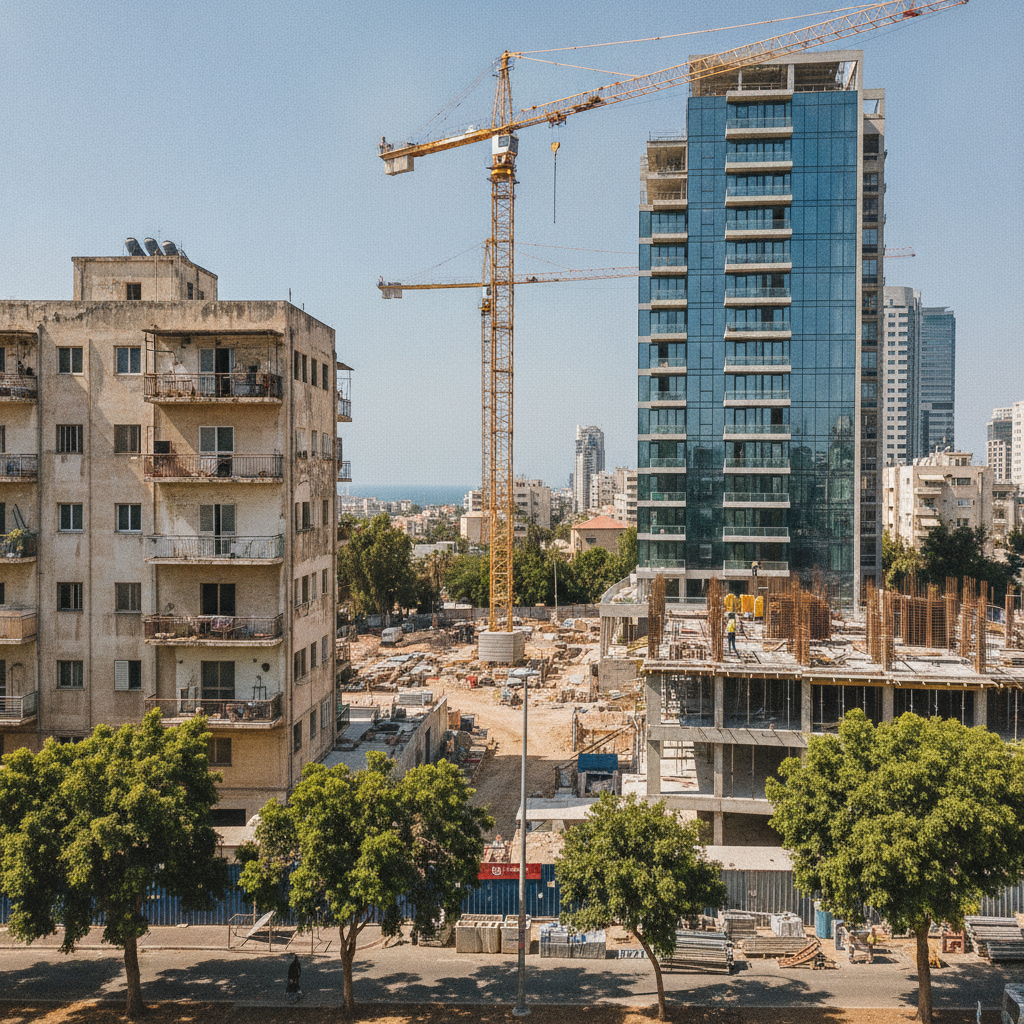
- New neighborhoods in the south and north of the city, expanding the supply.
What moderates the increase:
- An abundant supply of new properties, putting developers in competition;
- Buyers attentive to credit costs, as everywhere in the country.
For a full presentation of the city, read Netanya: why French speakers love this city.
Kfar Saba: Moving Upmarket
With +4.9%, or about 137,000 ₪, Kfar Saba records one of the strongest increases in the country, on par with Haifa and just behind Rehovot. The city now surpasses Netanya by around 200,000 ₪ in average price and ranks fifth among the 18 cities studied.
A green, residential city favored by families for its schools and quality of life, Kfar Saba has a more limited supply of new properties compared to Netanya. When demand remains strong and supply is constrained, prices rise more quickly.
Netanya, Kfar Saba or Herzliya
| Criteria | Netanya | Kfar Saba | Herzliya |
|---|---|---|---|
| Average price H1 2026 | 2.73M ₪ | 2.935M ₪ | 3.782M ₪ |
| Trend | moderate increase | strong increase | slight decrease |
| Sea access | yes | no | yes |
| Main profile | mixed, seaside | families, residential | high-end |
- Netanya offers sea access for about 28% less than Herzliya on average.
- Kfar Saba is ideal for those who prioritize family life and proximity to the center of the country.
- Herzliya remains the high-end benchmark, in a market now favorable to negotiation, as we explain in our dedicated analysis.
Key Points to Watch Out For
Don't Overpay for a Sea View
In Netanya, the difference between an apartment with an unobstructed sea view and a partial view can be significant. Check the plans for any future constructions that might block the view.
Anticipate Monthly Fees
Seafront towers often offer amenities (pool, gym, security). Monthly fees should be included in your budget, especially for a second home that is rarely occupied.
Calculate the Full Cost
18% VAT is included in the price of new properties, acquisition tax depends on your profile (primary residence, foreign resident, investor), and closing costs are around 10 to 13%. Get a first estimate with the taxes and fees calculator.
Work with the Right Experts
A lawyer checks the contract, bank guarantee, and delivery schedule. A broker structures the mashkanta. An architect validates the plans and specifications.
IsraelStart lists over 300 new projects throughout Israel, including many in Netanya and the Sharon, and supports buyers from abroad as well as Israelis already on site. A personalized, no-obligation assessment helps you choose the right city.
Sources and Method
- Ynet analysis of Central Bureau of Statistics (CBS) data, published September 15, 2026.
- Israel Central Bureau of Statistics (CBS) — average transaction prices by city and by number of rooms.
- Bank of Israel — real estate credit volumes (data from August 2026).
The prices for the first half of the year are an arithmetic average of the first two quarters, compared to the same calculation for 2025. The number of transactions is not weighted: a small sales volume can significantly affect a city's average. Indicative figures, to be cross-checked project by project before making any decisions.
Need personalized support?
An IsraelStart expert will call you within 24h with a personalized analysis of your project.